已解决
vue柱状图+折线图组合
来自网友在路上 184884提问 提问时间:2023-09-19 01:03:26阅读次数: 84
最佳答案 问答题库848位专家为你答疑解惑
<template><div id="main" style="width: 100%;height: 500px; padding-top: .6rem"></div>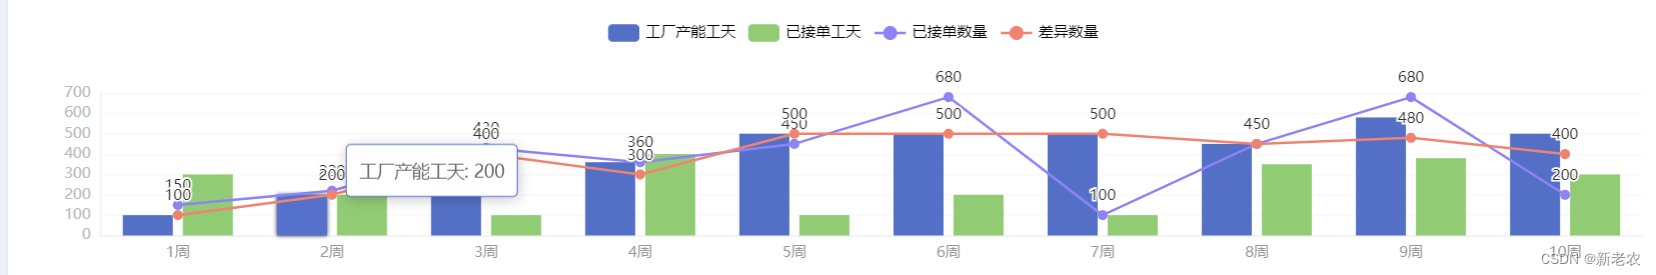
</template> data() {return {weekData: ["1周","2周","3周","4周","5周","6周","7周","8周","9周","10周"], //柱状图横轴jdslData: [150, 220, 430, 360, 450, 680, 100, 450, 680, 200], // 折线图的数据cyslData: [100, 200, 400, 300, 500, 500, 500, 450, 480, 400], // 柱状图1的数据plgtData: [100, 200, 430, 360, 500, 500, 500, 450, 580, 500], // 柱状图2的数据jdgtData: [300, 200, 100, 400, 100, 200, 100, 350, 380, 300], // 柱状图3的数据}},drawLine(xAxisData, lineData1, lineData2, barData1, barData2){let eChart = echarts.init(document.getElementById("main")); // 基于准备好的dom,初始化echarts实例this.eChart = eChart;eChart.setOption({// 绘制图表title: {text: ""},tooltip: {formatter: '{a}: {c}'},grid: {left: '3%',right: '3%',bottom: '3%',containLabel: true},legend: {//图例名show: true,data: ['工厂产能工天', '已接单工天', '已接单数量', '差异数量'],x: 'center', //图例在中间center 左边left 右边righttextStyle: { //图例字体的颜色color: "#000" //图例文字}},xAxis: [// x轴 10周{type: "category",axisTick: {show: false, // 坐标轴刻度。},axisLine: {show: true, // 坐标轴轴线。lineStyle: {color: "#eeeeee",},},axisLabel: {// 坐标轴刻度标签的相关设置。inside: false,textStyle: {color: "#999",fontWeight: "normal",fontSize: "12",},},splitLine: {show: false}, // 去除网格线data: xAxisData,},{type: "category",axisLine: {show: false}, // 是否显示坐标轴轴线。axisTick: {show: false}, // 是否显示坐标轴刻度。axisLabel: {show: false}, // 是否显示刻度标签。 柱状图上的标签splitArea: {show: false}, // 是否显示分隔区域。 背景遮罩splitLine: {show: false}, // 是否显示分隔线。},],yAxis: [// y轴{type: "value",axisTick: {show: false,},axisLine: {show: true,lineStyle: {color: "#eeeeee",},},axisLabel: {textStyle: {color: "#bac0c0",fontWeight: "normal",fontSize: "12",},formatter: "{value}",},splitLine: {show: true, // 去除网格线lineStyle: {color: '#f8f8f8'}},}],series: [{ // 柱状图1 工厂产能工天type: "bar",name: '工厂产能工天',itemStyle: {show: true,//color: "#7ca6f8", // 柱状图的颜色color: "#5470C6", // 柱状图的颜色borderWidth: 0,borderType: "solid",emphasis: {shadowBlur: 15,shadowColor: "rgba(105,123, 214, 0.7)",},},zlevel: 1,barWidth: 40,data: barData1,},{ // 柱状图2 已接单工天type: "bar",name: '已接单工天',itemStyle: {show: true,// color: "#6ebbb8",color: "#91CC75",borderWidth: 0,borderType: "solid",emphasis: {shadowBlur: 15,shadowColor: "rgba(105,123, 214, 0.7)",},},zlevel: 2,barWidth: 40,data: barData2,},{ // 折线1 已接单数量zlevel: 3,type: "line",name: '已接单数量',color: ["#8d83f7"], // 拐点颜色symbolSize: 8, // 拐点的大小symbol: "circle", // 拐点样式label: {show: true,position: 'top'},data: lineData1,itemStyle: {normal: {lineStyle: {color: "#8d83f7", // 折线的颜色type: "solid" // 折线的类型}}},tooltip: {formatter: '{b}<br/>已接单数量:{c}<br/>'}},{ // 折线2 差异数量zlevel: 4,type: "line",name: '差异数量',color: ["#ef836f"], // 拐点颜色symbolSize: 8, // 拐点的大小symbol: "circle", // 拐点样式label: {show: true,position: 'top'},data: lineData2,itemStyle: {normal: {lineStyle: {color: "#ef836f", // 折线的颜色type: "solid" // 折线的类型}}},tooltip: {formatter: '{b}<br/>差异数量:{c}<br/>'}}],});},that.drawLine(that.weekData,that.jdslData,that.cyslData,that.plgtData,that.jdgtData);
查看全文
99%的人还看了
相似问题
猜你感兴趣
版权申明
本文"vue柱状图+折线图组合":http://eshow365.cn/6-9004-0.html 内容来自互联网,请自行判断内容的正确性。如有侵权请联系我们,立即删除!
- 上一篇: k8s相关命令-命名空间
- 下一篇: linux systemctl删除失效的服务单元