已解决
Vue echarts 折线图 背景颜色渐变 (两种实现方式)
来自网友在路上 176876提问 提问时间:2023-10-26 16:45:25阅读次数: 76
最佳答案 问答题库768位专家为你答疑解惑
需求
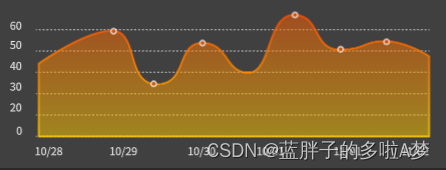
实现方式
两种方法
方法一:color: new echarts.graphic.LinearGradient(0, 0, 0, 1, [{},{},{}])
方法二:避开new echarts,color: {x: 0, y: 0, x2: 0, y2: 1,colorStops: [{},{},{}]}
option = {xAxis: {type: 'time',data: ['10/28', '10/29', '10/30', '10/31', '11/01', '11/02']},yAxis: {type: 'value'},series: [{data: [120, 200, 150, 80, 70, 110, 130],type: 'line',areaStyle: {  // 使用方法二的写法color: {type: 'linear',x: 0,  //右y: 0,  //下x2: 0,  //左y2: 1,  //上colorStops: [{offset: 0,color: '#A05920' // 0% 处的颜色},{         offset: 1,color: '#C7982A' // 100% 处的颜色}]}},emphasis: { // 选中时的颜色itemStyle: { // 使用方法一的写法color: new echarts.graphic.LinearGradient(0, 0, 0, 1, [{ offset: 0, color: '#A05920' },{ offset: 1, color: '#C7982A' }])}}}]
};
tips:
如果new echarts.graphic.LinearGradient报错,不能正常显示
可使用:new this.$echarts.graphic
color: [new this.$echarts.graphic.LinearGradient(0, 0, 0, 1, [{ offset: 0, color: '#A05920' },{ offset: 1, color: '#C7982A' }]),new this.$echarts.graphic.LinearGradient(0, 0, 0, 1, [{ offset: 1, color: "#08DDF280" },{ offset: 0, color: "#3D9CF580" },]),], //自定义颜色
查看全文
99%的人还看了
相似问题
- QT中样式表常见属性与颜色的设置与应用
- OpenLayers实战,WebGL图层根据Feature要素的变量动态渲染多种颜色的三角形,适用于大量三角形渲染不同颜色
- Threejs_08 纹理颜色的调整(颜色空间的设置)
- 数据处理生产环境_利用MurmurHash3算法在Spark和Scala中生成随机颜色
- vue中使用echarts实现省市地图绘制,根据数据显示不同区域颜色,点击省市切换,根据经纬度打点
- 【CSS】各百分比透明度 opacity 对应的 16 进制颜色值(例如:#FFFFFF80)
- BetterDisplay Pro v2.0.11(显示器颜色校准软件)
- Kotlin语言实现单击任意TextVIew切换一个新页面,并且实现颜色变换
- vColorPicker与vue3-colorPicker——基于 Vue 的颜色选择器插件
- PySide/PYQT如何用Qt Designer和代码来设置文字属性,如何设置文字颜色?
猜你感兴趣
版权申明
本文"Vue echarts 折线图 背景颜色渐变 (两种实现方式)":http://eshow365.cn/6-25247-0.html 内容来自互联网,请自行判断内容的正确性。如有侵权请联系我们,立即删除!