已解决
uni-app:引入echarts(使用renderjs)
来自网友在路上 178878提问 提问时间:2023-10-08 22:27:36阅读次数: 78
最佳答案 问答题库788位专家为你答疑解惑
效果
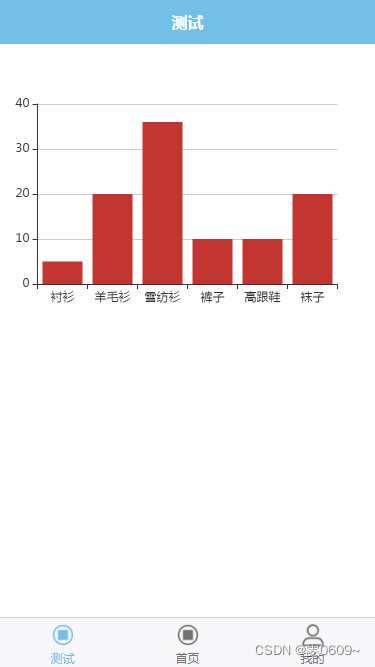
代码
<template><view @click="echarts.onClick" :prop="option" :change:prop="echarts.updateEcharts" id="echarts" class="echarts"></view>
</template><script>export default {data() {return {option: '',x: ["衬衫", "羊毛衫", "雪纺衫", "裤子", "高跟鞋", "袜子"],y: [5, 20, 36, 10, 10, 20]}},onLoad() {this.option = {tooltip: {},xAxis: {data: this.x},yAxis: {},series: [{name: '销量',type: 'bar',data: this.y}]}},methods: {}}
</script><script module="echarts" lang="renderjs">let myChartexport default {mounted() {if (typeof window.echarts === 'function') {this.initEcharts()} else {// 动态引入较大类库避免影响页面展示const script = document.createElement('script')// view 层的页面运行在 www 根目录,其相对路径相对于 www 计算script.src = 'static/js/echarts.js'script.onload = this.initEcharts.bind(this)document.head.appendChild(script)}},methods: {initEcharts() {myChart = echarts.init(document.getElementById('echarts'))// 观测更新的数据在 view 层可以直接访问到myChart.setOption(this.option)},updateEcharts(newValue, oldValue, ownerInstance, instance) {// 监听 service 层数据变更if (myChart != undefined) {myChart.setOption(newValue)}},}}
</script><style>.echarts {width: 100%;height: 300px;}
</style>
参照代码
renderjs-echarts-demo - DCloud 插件市场
参照的效果
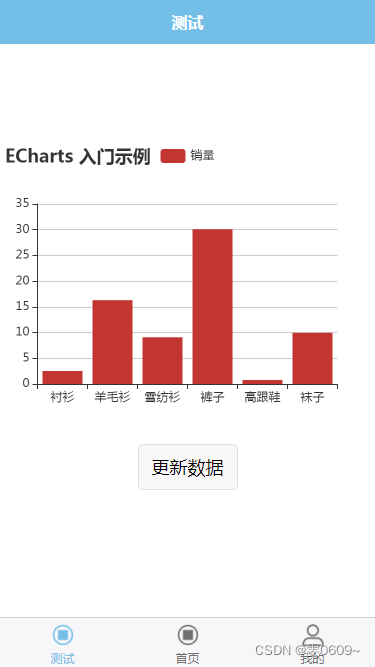
<template><view class="content"><!-- #ifdef APP-PLUS || H5 --><view @click="echarts.onClick" :prop="option" :change:prop="echarts.updateEcharts" id="echarts" class="echarts"></view><button @click="changeOption">更新数据</button><!-- #endif --><!-- #ifndef APP-PLUS || H5 --><view>非 APP、H5 环境不支持</view><!-- #endif --></view>
</template><script>export default {data() {return {option: {title: {text: 'ECharts 入门示例'},tooltip: {},legend: {data: ['销量']},xAxis: {data: ["衬衫", "羊毛衫", "雪纺衫", "裤子", "高跟鞋", "袜子"]},yAxis: {},series: [{name: '销量',type: 'bar',data: [5, 20, 36, 10, 10, 20]}]}}},onLoad() {},methods: {changeOption() {const data = this.option.series[0].data// 随机更新示例数据data.forEach((item, index) => {data.splice(index, 1, Math.random() * 40)})},onViewClick(options) {console.log(options)}}}
</script><script module="echarts" lang="renderjs">let myChartexport default {mounted() {if (typeof window.echarts === 'function') {this.initEcharts()} else {// 动态引入较大类库避免影响页面展示const script = document.createElement('script')// view 层的页面运行在 www 根目录,其相对路径相对于 www 计算script.src = 'static/js/echarts.js'script.onload = this.initEcharts.bind(this)document.head.appendChild(script)}},methods: {initEcharts() {myChart = echarts.init(document.getElementById('echarts'))// 观测更新的数据在 view 层可以直接访问到myChart.setOption(this.option)},updateEcharts(newValue, oldValue, ownerInstance, instance) {// 监听 service 层数据变更if (myChart != undefined) {myChart.setOption(newValue)}},onClick(event, ownerInstance) {// 调用 service 层的方法ownerInstance.callMethod('onViewClick', {test: 'test'})}}}
</script><style>.content {display: flex;flex-direction: column;align-items: center;justify-content: center;}.echarts {margin-top: 100px;width: 100%;height: 300px;}
</style>
查看全文
99%的人还看了
相似问题
猜你感兴趣
版权申明
本文"uni-app:引入echarts(使用renderjs)":http://eshow365.cn/6-17458-0.html 内容来自互联网,请自行判断内容的正确性。如有侵权请联系我们,立即删除!
- 上一篇: 服务器or虚拟机安装SSH和虚拟机or服务器设置远程服务权限
- 下一篇: QT实现tcp服务器客户端