已解决
【vue3/echarts】vue3中使用echarts/饼图/双轴双数据柱状图
来自网友在路上 194894提问 提问时间:2023-11-08 12:50:14阅读次数: 94
最佳答案 问答题库948位专家为你答疑解惑
npm下载echarts
引入使用
<script>
import Box from "@/components/box.vue";
import { onMounted } from 'vue';
import { init } from 'echarts';
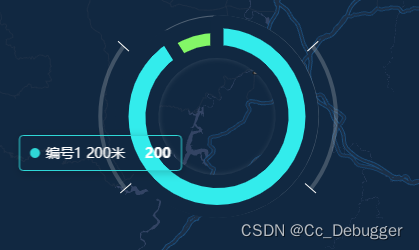
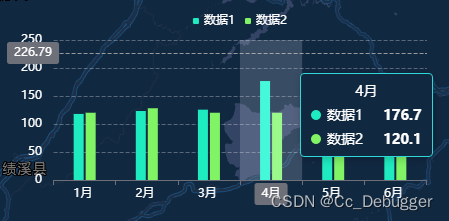
export default {components: {Box: Box},setup() {onMounted(() => {// 饼图const charEle = document.getElementById('echarts1');const charEch = init(charEle);const colorList = ['#2FD7D7 ', '#83F767', '#59CB74', '#FBD444', '#7F6AAD', '#585247', '#ff0000']const option = {tooltip: {show: true,trigger: 'item',backgroundColor: 'transparent',borderColor: '#2FD7D7',textStyle: {color: '#fff'}},color: colorList,series: [{name: '',type: 'pie',radius: [65, 90],center: ['48%', '49%'],label: {show: false},labelLine: {show: false},itemStyle: {borderWidth: 13,borderColor: '#112841'},data: [{ name: '编号1 200米', value: 200 },{ name: '编号2 200米', value: 20 },],}]};charEch.setOption(option);const charEle2 = document.getElementById('echarts2');const charEch2 = init(charEle2);var xData = ['1月', '2月', '3月', '4月', '5月', '6月'];var moneyData = [118.0, 123.2, 125.6, 176.7, 115.6, 162.2];var numData = [120.1, 128.1, 120.1, 120.1, 128.1, 128.1];const option2 = {tooltip: {// show: false,trigger: 'axis',backgroundColor: '#112841',borderColor: '#2FD7D7',textStyle: {color: '#fff'},axisPointer: {type: 'cross',crossStyle: {color: '#999',},},},grid: {top: 50},legend: {data: ['数据1','数据2'],top: '20',itemWidth: 6,itemHeight: 6,textStyle: {color: '#fff'}},xAxis: [{type: 'category',data: xData,axisPointer: {type: 'shadow',},axisLabel: {formatter: '{value} ',color: '#fff'},},],yAxis: [{type: 'value',name: '',min: 0,max: 250,interval: 50,splitLine: {lineStyle: {type: "dashed",color: "#fff",opacity: 0.3}},axisLabel: {formatter: '{value} ',color: '#fff'},},// y右侧轴// {// type: 'value',// name: '',// min: 0,// max: 25,// interval: 5,// axisLabel: {// formatter: '{value} ',// },// },],series: [{name: '数据1',type: 'bar',data: moneyData,color: '#1FEBC0',tooltip: {valueFormatter: function (value) {return value + '';},},// 柱体上方显示数值label: {show: false,position: 'top',},barWidth: 10},{name: '数据2',type: 'bar',data: numData,color: '#81F466',// 柱体上方显示数值label: {show: false,position: 'top',},barWidth: 10},],};charEch2.setOption(option2);});return {}},
}
</script>
查看全文
99%的人还看了
猜你感兴趣
版权申明
本文"【vue3/echarts】vue3中使用echarts/饼图/双轴双数据柱状图":http://eshow365.cn/6-35365-0.html 内容来自互联网,请自行判断内容的正确性。如有侵权请联系我们,立即删除!
- 上一篇: web —— html
- 下一篇: iview table 表格合并单元格