已解决
vue在el-tab中使用echart(出现canvas高宽一直是100px问题+echart随外层div变化而自适应)
来自网友在路上 189889提问 提问时间:2023-09-25 10:37:38阅读次数: 89
最佳答案 问答题库898位专家为你答疑解惑
问题1:canvas高宽一直是100px问题
解决方法:使用v-if,参考文献https://blog.csdn.net/qq_42527726/article/details/106147539?utm_medium=distribute.pc_relevant.none-task-blog-2~default~baidujs_utm_term~default-0-106147539-blog-132323416.235^v38^pc_relevant_default_base&spm=1001.2101.3001.4242.1&utm_relevant_index=3
template部分:
<el-tabs v-model="activeName" @tab-click="handleClick"><el-tab-pane label="运行状态" name="first">...</el-tab-pane><el-tab-pane label="镜像数据统计" name="second">...</el-tab-pane><el-tab-pane label="实验在线人数统计" name="third"><div v-if="isshow" style="height:500px;width:100%"><myEcharts height='100%' width='100%'></myEcharts></div></el-tab-pane>
</el-tabs>
script部分:
<script>
import myEcharts from './echarts'
export default {components:{myEcharts},data(){return{isshow:false,}},methods:{handleClick(tab, event){if(tab.name=="third"){this.isshow=true}else{this.isshow=false}},}
echarts组件部分:
<template><div style="width:100%;height:100%"><div id="myChart" style="width:100%;height:100%"></div></div>
</template>
<script>
export default {data(){return{}},methods:{//画图表drawLine(){// 基于准备好的dom,初始化echarts实例let myChart = this.$echarts.init(document.getElementById('myChart'))// 绘制图表myChart.setOption({title: {text:"实验人数统计"},tooltip: {},xAxis: {data: ["衬衫","羊毛衫","雪纺衫","裤子","高跟鞋","袜子"]},yAxis: {},series: [{name: '销量',type: 'bar',data: [5, 20, 36, 10, 10, 20],itemStyle:{normal:{color:'#409EFF'}},}]});},},mounted(){this.drawLine()},
}
</script>
<style scoped></style>
问题2:一般都是echart随windows窗口变化而变化,现在需求是外层div能够被拖动,而echart不会随着外层div变化而变化
解决方法:使用element-resize-detector插件监听div
在main.js文件中
// (用来监听div变化)
import ElementResizeDetectorMaker from "element-resize-detector";
Vue.prototype.$erd = ElementResizeDetectorMaker();
在写echart的文件中
在script代码为:
主要代码:
const _this = this;this.$erd.listenTo(this.$refs.echartButtom, () => {_this.$nextTick(() => {myChart.resize();});});问题3:柱状图叠图
option = {tooltip : {trigger: 'axis',axisPointer : { // 坐标轴指示器,坐标轴触发有效type : 'shadow' // 默认为直线,可选为:'line' | 'shadow'}},legend: {data: ['直接访问', '邮件营销','联盟广告','视频广告','搜索引擎']},toolbox: {show: true,feature: {dataZoom: {yAxisIndex: 'none'},dataView: {readOnly: false},magicType: {type: ['line', 'bar']},restore: {},saveAsImage: {}}},grid: {left: '3%',right: '4%',bottom: '3%',containLabel: true},xAxis: {type: 'category',data: ['周一','周二','周三','周四','周五','周六','周日']},yAxis: {type: 'value'},series: [{name: '直接访问',type: 'bar',stack: '总量',smooth: true,label: {normal: {show: true,position: 'insideTop',formatter: function(v) {return v.value || ""}}},data: [302, 302, 301, 334, 390, 330, 320]},{name: '邮件营销',type: 'bar',stack: '总量',smooth: true,label: {normal: {show: true,position: 'insideTop',formatter: function(v) {return v.value || ""}}},data: [120, 132, 101, 134, 90, 230, 210]},{name: '联盟广告',type: 'bar',stack: '总量',smooth: true,label: {normal: {show: true,position: 'insideTop',formatter: function(v) {return v.value || ""}}},data: [220, 182, 191, 234, 290, 330, 310]},{name: '视频广告',type: 'bar',stack: '总量',smooth: true,label: {normal: {show: true,position: 'insideTop',formatter: function(v) {return v.value || ""}}},data: [150, 212, 201, 154, 190, 330, 410]},{name: '搜索引擎',type: 'bar',stack: '总量',smooth: true,label: {normal: {show: true,position: 'insideTop',formatter: function(v) {return v.value || ""}}},data: [820, 832, 901, 934, 1290, 1330, 1320]},{name: '总计',type: 'bar',stack: '总计',barGap: '-100%',smooth: true,label: {normal: {show: true,position: 'top',textStyle: { color: '#000' },formatter: function(v) {return "总计:" + (v.value)}}},itemStyle: {normal: {color: 'rgba(128, 128, 128, 0)',borderWidth: 1,borderColor: '#1FBCD2'}},data: [1600,1600,1600,1600,1600,2600]}]
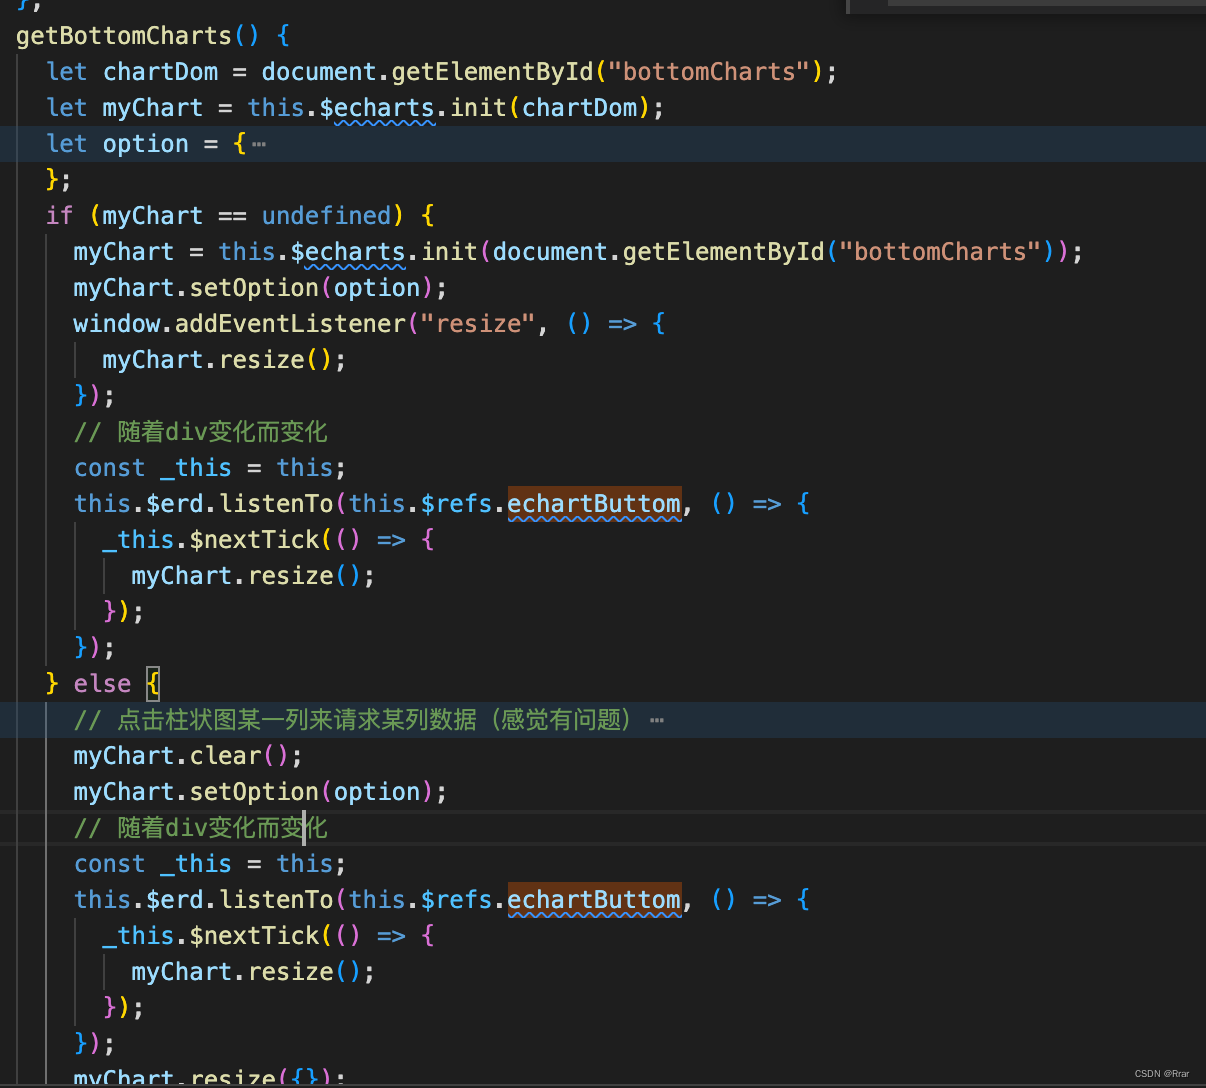
};问题4:柱状叠图点击不同区域显示不同弹窗内容(主要代码)
if (myChart == undefined) {myChart = this.$echarts.init(document.getElementById("bottomCharts"));myChart.setOption(option);window.addEventListener("resize", () => {myChart.resize();});// 随着div变化而变化const _this = this;let form ={};this.$erd.listenTo(this.$refs.echartButtom, () => {_this.$nextTick(() => {myChart.resize();});});myChart.on("click", function (params) {if(params.seriesName == '计划航班'){form.queryFlag = 'eobt';}else if(params.seriesName == '离场航班'){form.queryFlag = 'adep';}else{form.queryFlag = 'ades';}let index = params.dataIndex;form.startTime = timeRangList[index];form.endTime = timeRangList[index + 1];getPlanListByHour(form).then((res)=>{_this.tableData = res.data.data;})_this.showPlanDetail = true;});} else {myChart.clear();myChart.setOption(option);myChart.off("click")let form ={};const _this = this;myChart.on("click", function (params) {if(params.seriesName == '计划航班'){form.queryFlag = 'eobt';}else if(params.seriesName == '离场航班'){form.queryFlag = 'adep';}else{form.queryFlag = 'ades';}let index = params.dataIndex;form.startTime = timeRangList[index];form.endTime = timeRangList[index + 1];getPlanListByHour(form).then((res)=>{_this.tableData = res.data.data;})_this.showPlanDetail = true;});}结果: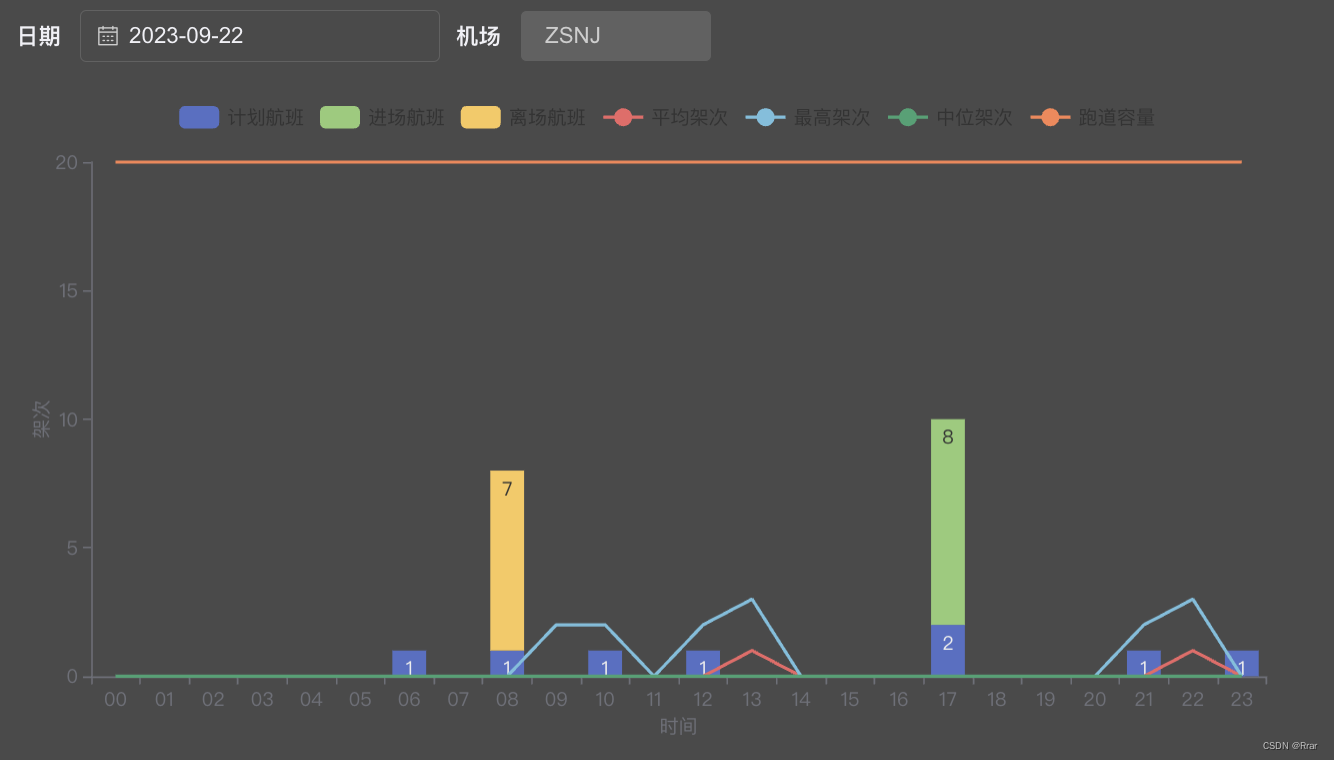
所有代码:
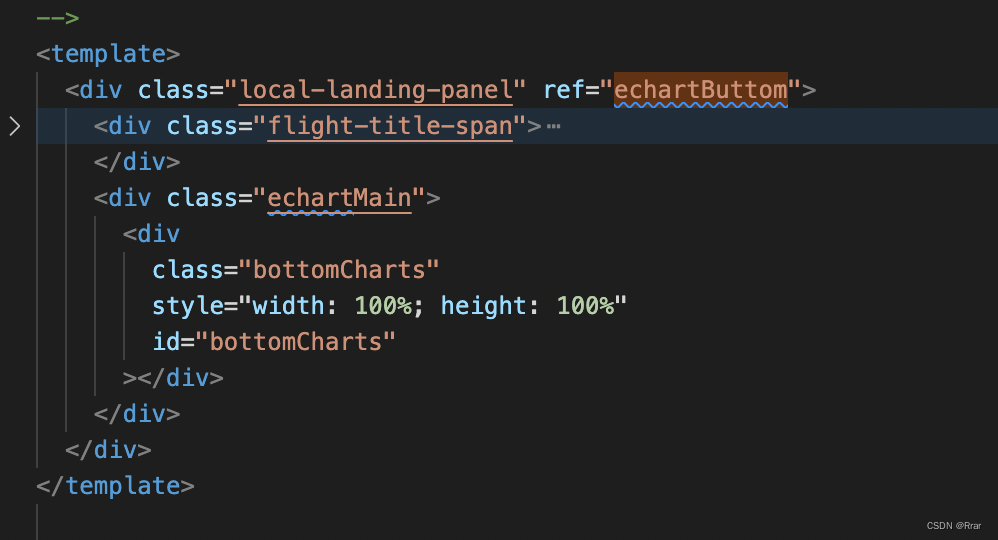
<!--* @Author: * @Description: * @Date: 2023-09-19 16:42:56* @LastEditTime: 2023-09-22 09:35:57
-->
<template><div class="local-landing-panel" ref="echartButtom"><div class="flight-title-span"><!-- <span class="small-module-title-label">本场降落航班计划</span> --><el-form:inline="true":model="formInline"ref="form"class="flight-title-span"><el-form-item label="日期" prop="queryDate"><el-date-pickerv-model="formInline.queryDate"value-format="yyyy-MM-dd"type="date"placeholder="选择日期"@blur="queryFlightData()"></el-date-picker></el-form-item><el-form-item label="机场" prop="airport"><el-inputv-model="airport"style="width: 120px"maxlength="8":disabled="true"></el-input></el-form-item></el-form></div><div class="echartMain"><divclass="bottomCharts"style="width: 100%; height: 100%"id="bottomCharts"></div></div><!-- 飞行计划详情页面 --><FlightDataDetail:showDetail.sync="showPlanDetail":tableData="tableData"@handleDetail="handlePlanDetailDialog"></FlightDataDetail></div>
</template><script>
import { statFlightNumByHour,getPlanListByHour } from "@/api/homePage.js";
import FlightDataDetail from "@/views/sipds/plan/flightDataDetail";export default {components: { FlightDataDetail },data() {return {formInline: {queryDate: this.moment().format("YYYY-MM-DD"),},airport: "",showPlanDetail: false,planRow: "",tableData: [] // 传给子组件的参数};},mounted() {this.queryFlightData();this.airport = window.ownAirportCode;},//页面销毁时beforeDestroy() {},methods: {queryFlightData() {let param = {};param.queryDate = this.processParam(this.formInline.queryDate);statFlightNumByHour(param).then((res) => {if (res.data.code == "1") {let resData = res.data.data;let timeRangList = [];let planNumList = [];let adepNumList = [];let adesNumList = [];let medianNumList = [];let maximumList = [];let averageList = [];let capacityList = [];let totalList = [];// 遍历data数组for (let i = 0; i < resData.length; i++) {let item = resData[i];// 将数据分别存储到对应的数组中timeRangList.push(item.timeRang);planNumList.push(item.planNum);adepNumList.push(item.adepNum);adesNumList.push(item.adesNum);medianNumList.push(item.medianNum);maximumList.push(item.maximum);averageList.push(item.average);capacityList.push(item.capacity);}for (let i = 0; i < planNumList.length; i++) {let totalValue = planNumList[i] + adepNumList[i] + adesNumList[i];totalList.push(totalValue);}let finalHour = this.formInline.queryDate + ' 24:00:00';timeRangList.push(finalHour) // 方便发送弹窗接口需要的参数let timeRangListNumber = ['00','01','02','03','04','05','06','07','08','09','10','11','12','13','14','15','16','17','18','19','20','21','22','23'];this.getBottomCharts(timeRangListNumber,planNumList,adepNumList,adesNumList,medianNumList,maximumList,averageList,capacityList,totalList,timeRangList);} else {return false;}});},processParam(inputDateStr) {// 创建一个新的Date对象并将日期字符串解析为日期var inputDate = new Date(inputDateStr);// 获取年、月、日、小时、分钟和秒var year = inputDate.getFullYear();var month = String(inputDate.getMonth() + 1).padStart(2, "0"); // 月份从0开始,需要加1,并补0var day = String(inputDate.getDate()).padStart(2, "0");var hours = "00"; // 设置小时为00var minutes = "00"; // 设置分钟为00var seconds = "00"; // 设置秒钟为00// 构建新的日期时间字符串var dateTimeStr = `${year}-${month}-${day} ${hours}:${minutes}:${seconds}`;return dateTimeStr; // 输出结果:2023-09-20 00:00:00},getBottomCharts(timeRangListNumber,planNumList,adepNumList,adesNumList,medianNumList,maximumList,averageList,capacityList,totalList,timeRangList) {let myChart = this.$echarts.getInstanceByDom(document.getElementById("bottomCharts"));let option = {tooltip: {// 提示框trigger: "axis", // 鼠标只要在轴上就会触发axisPointer: {// 坐标轴指示器,坐标轴触发有效type: "shadow", // 默认为直线,可选为:'line' | 'shadow'},},legend: {data: ["计划航班","进场航班","离场航班","平均架次","最高架次","中位架次","跑道容量",],},// toolbox: {//   // 工具栏//   show: true,//   feature: {//     dataZoom: {//       //数据区域缩放//       yAxisIndex: "none",//     },//     dataView: { readOnly: false }, //数据视图//     magicType: { type: ["line", "bar"] }, // //动态类型切换//     restore: {}, //重置//     saveAsImage: {}, //导出图片//   },// },grid: {left: "3%",right: "4%",bottom: "8%",top:40,containLabel: true,},xAxis: {name: "时间",nameGap: 25,nameLocation: "middle",type: "category",data: timeRangListNumber,},yAxis: {name: "架次",nameRotate: 90, // y轴name旋转90度 使其垂直nameGap: 25, // y轴name与横纵坐标轴线的间距nameLocation: "middle", // y轴name处于y轴的什么位置axisLine: {show: true,},axisTick: {//刻度show: true, // 显示刻度线},type: "value",splitLine: {//坐标轴在grid区域中的分隔线(网格中的横线)show: false,lineStyle: {color: ["#B8B8B8"],width: 1,type: "solid",},},},series: [{name: "计划航班",type: "bar",stack: "总量",smooth: true,label: {normal: {show: true,position: "insideTop",formatter: function (v) {return v.value || "";},},},data: planNumList,},{name: "进场航班",type: "bar",stack: "总量",smooth: true,label: {normal: {show: true,position: "insideTop",formatter: function (v) {return v.value || "";},},},data: adesNumList,},{name: "离场航班",type: "bar",stack: "总量",smooth: true,label: {normal: {show: true,position: "insideTop",formatter: function (v) {return v.value || "";},},},data: adepNumList,},{//折线图name: "平均架次",// 这里要修改成y_cdata: averageList,symbol: "circle", //拐点设置为实心symbolSize: 0, //拐点大小type: "line",itemStyle: {normal: {label: {show: false,position: "top",},},},},{//折线图name: "最高架次",// 这里要修改成y_cdata: maximumList,symbol: "circle", //拐点设置为实心symbolSize: 0, //拐点大小type: "line",itemStyle: {normal: {label: {show: false,position: "top",},},},},{//折线图name: "中位架次",// 这里要修改成y_cdata: medianNumList,symbol: "circle", //拐点设置为实心symbolSize: 0, //拐点大小type: "line",itemStyle: {normal: {label: {show: false,position: "top",},},},},{//折线图name: "跑道容量",// 这里要修改成y_cdata: capacityList,type: "line",symbol: "circle", //拐点设置为实心symbolSize: 0, //拐点大小itemStyle: {normal: {label: {show: false,position: "top",},},},},// {//   name: "总计",//   type: "bar",//   // stack: "总计",//   barGap: "-100%",//   smooth: true,//   label: {//     normal: {//       show: true,//       position: "top",//       textStyle: { color: "#000" },//       // formatter: function (v) {//       //   return "总计:" + v.value;//       // },//       formatter: "{c}",//     },//   },//   itemStyle: {//     normal: {//       color: "rgba(128, 128, 128, 0)",//       // borderWidth: 0,//       // borderColor: "#1FBCD2",//     },//   },//   data: totalList,// },],};if (myChart == undefined) {myChart = this.$echarts.init(document.getElementById("bottomCharts"));myChart.setOption(option);window.addEventListener("resize", () => {myChart.resize();});// 随着div变化而变化const _this = this;let form ={};this.$erd.listenTo(this.$refs.echartButtom, () => {_this.$nextTick(() => {myChart.resize();});});myChart.on("click", function (params) {if(params.seriesName == '计划航班'){form.queryFlag = 'eobt';}else if(params.seriesName == '离场航班'){form.queryFlag = 'adep';}else{form.queryFlag = 'ades';}let index = params.dataIndex;form.startTime = timeRangList[index];form.endTime = timeRangList[index + 1];getPlanListByHour(form).then((res)=>{_this.tableData = res.data.data;})_this.showPlanDetail = true;});} else {myChart.clear();myChart.setOption(option);myChart.off("click")let form ={};const _this = this;myChart.on("click", function (params) {if(params.seriesName == '计划航班'){form.queryFlag = 'eobt';}else if(params.seriesName == '离场航班'){form.queryFlag = 'adep';}else{form.queryFlag = 'ades';}let index = params.dataIndex;form.startTime = timeRangList[index];form.endTime = timeRangList[index + 1];getPlanListByHour(form).then((res)=>{_this.tableData = res.data.data;})_this.showPlanDetail = true;});}},//飞行计划详情弹框隐藏handlePlanDetailDialog(val) {this.showPlanDetail = val;},},
};
</script><style scoped>
.local-landing-panel {height: 100%;width: 100%;/* display: flex;flex-direction: column; */
}
.small-module-title-label {color: #9fe1f9;font-weight: 700;font-size: 16px;margin-bottom: 5px;
}.flight-title-span {margin-bottom: 5px;
}.flight-title-span >>> .el-radio {margin-right: 10px;
}.flight-title-span >>> .el-radio__label {margin-left: 3px;
}.cstat-radio {float: right;width: 322px;
}
.echartMain {height: calc(100% - 50px);width: 100%;
}
</style>
查看全文
99%的人还看了
相似问题
猜你感兴趣
版权申明
本文"vue在el-tab中使用echart(出现canvas高宽一直是100px问题+echart随外层div变化而自适应)":http://eshow365.cn/6-13400-0.html 内容来自互联网,请自行判断内容的正确性。如有侵权请联系我们,立即删除!
- 上一篇: 内部表和外部表的区别
- 下一篇: Spring Boot实现对超大文件进行异步压缩下载